Breakdown and Carrydown - By The Numbers
In our last Inside Line feature article, Breakdown and Carrydown – Then and Now, we discussed the reasons why breakdown and carrydown are different today. For this edition’s feature article, we will add some data and visuals to support the previous article. The data was taken from the recently concluded European Bowling Tour Masters in Munich, Germany and it shows the same thing we often see in bowling tournaments today.
The event consisted of the top 16 men and women from the 2011 European Bowling Tour point list. On the men’s side there was a mix of styles; high rev players, medium rev players, and low rev players, with fourteen right-handed players and two left-handed players. On the women’s side there was also a good mix of styles, even though most fall into the medium to low rev rate category, with 15 right-handed players and one left-handed player.
The players on the men’s side were: Martin Larsen (RH), Mika Koivuniemi (RH), Karl Wahlgren (RH), Sean Rash (RH), Gery Verbruggen (LH), Dominic Barrett (RH), Perttu Jussila (RH), Syafiq Ridhwan (RH), Osku Palermaa (RH), Mik Stampe (RH), Paul Moor (LH), Dennis Eklund (RH), Jesper Agerbo (RH), Robert Andersson (RH), Thomas Larsen (RH), and Stuart Williams (RH).
The players on the women’s side were: Rebecka Larsen (RH), Clara Guerrero (RH), Mai Ginge Jensen (RH), Krista Pöllänen (RH), Nina Flack (RH), Patricia Luoto (RH), Wendy Kok (RH), Bianca Wiekeraad (LH), Britt Brøndsted (RH), Joline Persson-Planefors (RH), Jacqueline Sijore (RH), Zandra Aziela (RH), Lisanne Breeschoten (RH), Nicole Sanders (LH), Heidi Thorstensen (RH), Sascha Wedel (RH).
The Data and Graphics - Breakdown
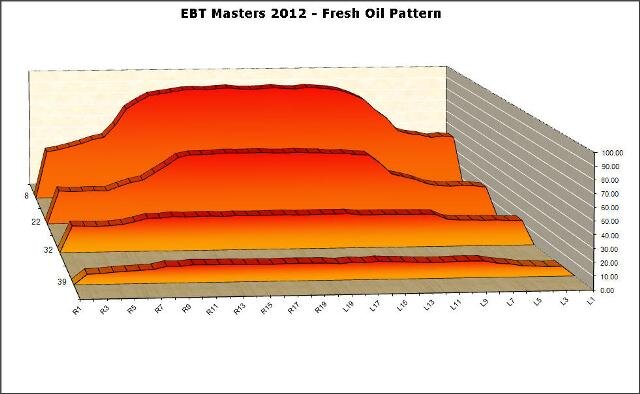
The oil pattern used for the event was Kegel’s Navigation Sport Series pattern The Turnpike. This pattern is almost flat from the midlane to the end of the pattern because the forward application consists of only 2L-2R loads. The shape from the mid portion of the oil pattern to the foul line is built on the return pass.
Here is a graphic of the fresh oil pattern with tapes taken at 8’, 22’, 32’ and 39’ (left side of the graphic is the right side of lane, right side of graphic is left side of lane – you are looking at these graphs from the pins perspective):
As we have known for many years, apart from the type of equipment being used, how the oil pattern breaks down is dependent on where the players play on the lane. When styles or rev rates are more similar, players tend to play in a more similar area of the lane, causing a much different type of pattern breakdown than when styles and rev rates are more diverse.
During the EBT Masters, all blocks consisted of 6 games with four players per pair, which equals 12 games per lane, plus ten minutes of practice. In comparison, a five person league would be 15 games per lane, plus 10 minutes of practice.
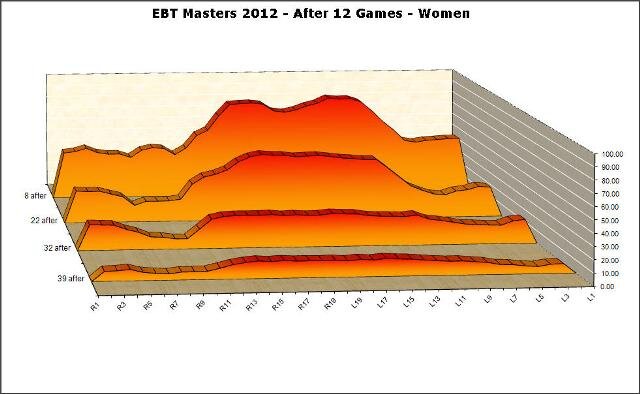
Here is the graphic of the EBT Masters pattern after one block of play by the women:
Here is the same graphic of the men’s pattern breakdown after one block of play:
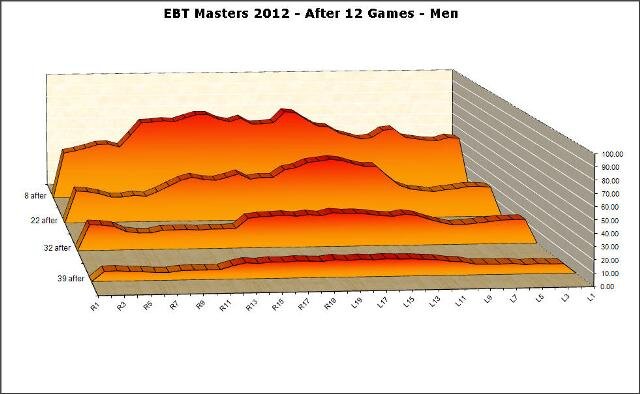
You can plainly see (I hope!) that the pattern breaks down significantly different when styles/rev rates are more similar versus when styles/rev rates are more diverse.
Here is a graphic of the before to after bowling between the men players and the women players at each tape distance, 8’, 22’, 32’ and 39’ (fresh oil is behind the after bowling tape):
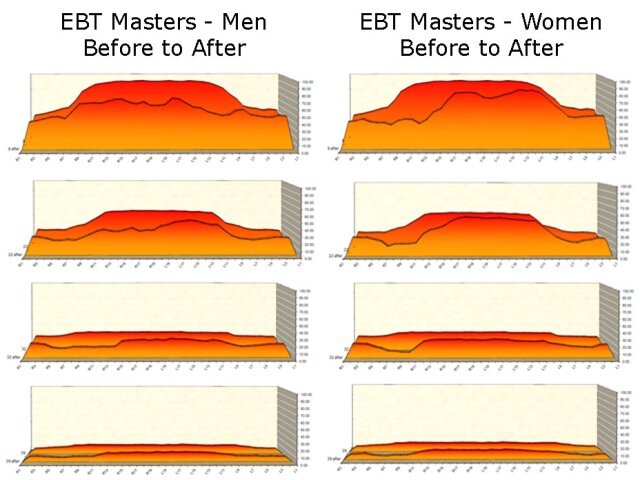
This graphic clearly shows how the lower rev rate women players “cliff” the oil pattern much more than the men players simply because the women play in a more similar area.
But now comes the interesting part of this breakdown pictorial and data article – the numbers.
What we often track is the oil depletion in percentages from that of the fresh oil pattern. As you will see, the percentages match up to the above graphics. What might surprise you is how much each group depleted. Common thought is high rev players deplete much more conditioner than lower rev players, but is it really so?
Here is the depletion by percentage on the men’s side of the event, with the square boxed area being a guide to show where the greatest depletion took place:
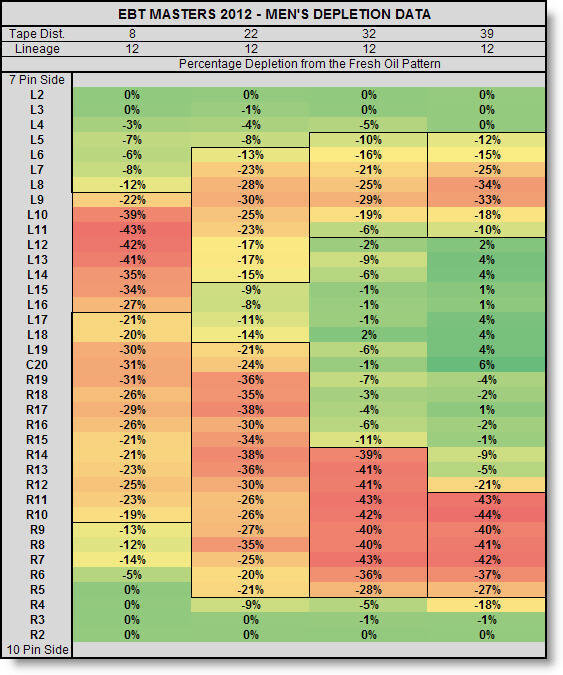
As you can see, the men took off about 40 plus percent at each distance throughout the oil pattern. After about 4 games of play, the right-handed players and the left-handed players came together in the fronts (8 feet) from boards L10 to L15, causing the greater depletion numbers in that area.
Before that move left, the right-handed men players continually moved towards the inside portion of the lane in their lay down area, yet they were still playing to near the same exit part of this 41’ oil pattern, between boards R5 and R11.
So how many units were left in the oil pattern after play? And what area of the depletion caused them to move left?
Here is a graphic of the before, on the left side of the graphic, and after tape data, on the right side of the graphic:
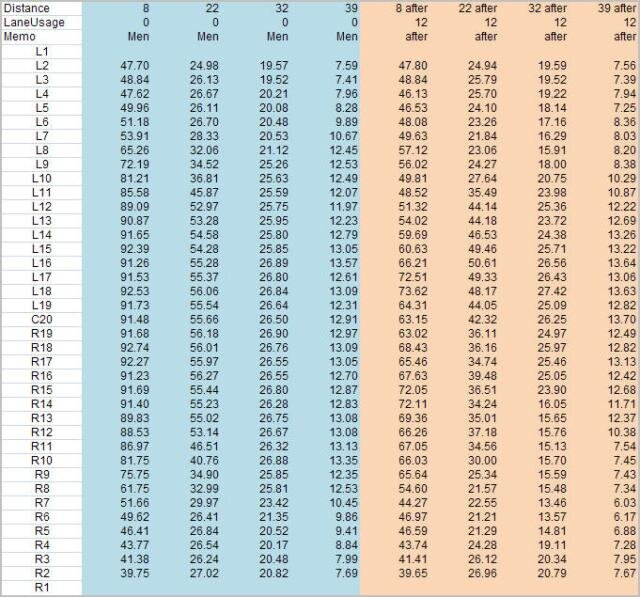
As you can plainly see, at the 8 foot distance of the pattern, after 12 games plus practice there was still over 60 units of oil on the lane. Only when the left-handers and right-handers lay down point became similar did we see the 50 unit barrier get broken, and that was only on a couple boards.
As we pointed out in the last feature article, the depletion towards the end of the oil pattern is what causes players to move left in today’s game, not “the fronts”.
Now the depletion tape data in percentages from the women’s side of the event, and as before, the square boxed area is a guide to show where the greatest depletion took place:
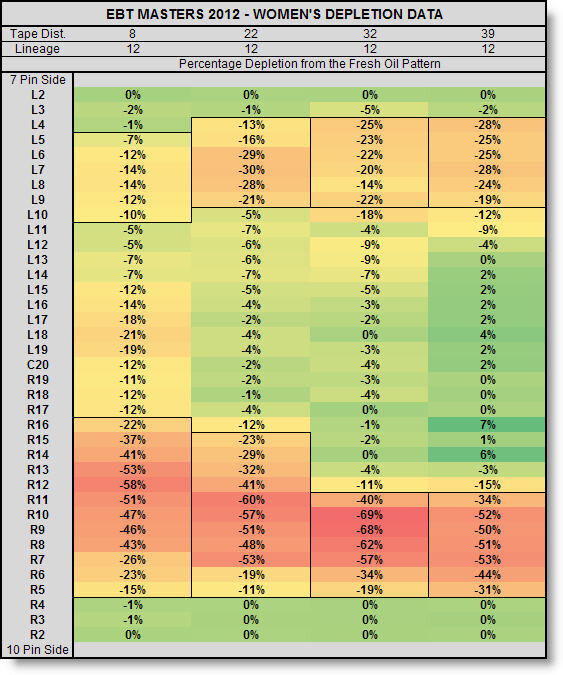
As you can see, because the women’s styles are more similar, as well as their rev rates, this group tends to play in a tighter area of the lane. This causes more depletion than when everyone is spread out all over the lane.
If you notice, the greatest percentage of depletion is at the 32 foot mark. The reason is, for the women players, all shots are starting to come together at this distance and there is more oil in that area than the end of the pattern - more oil equals more change.
Now let’s look at the same graph of the tape data in units of a women’s block after 12 games:
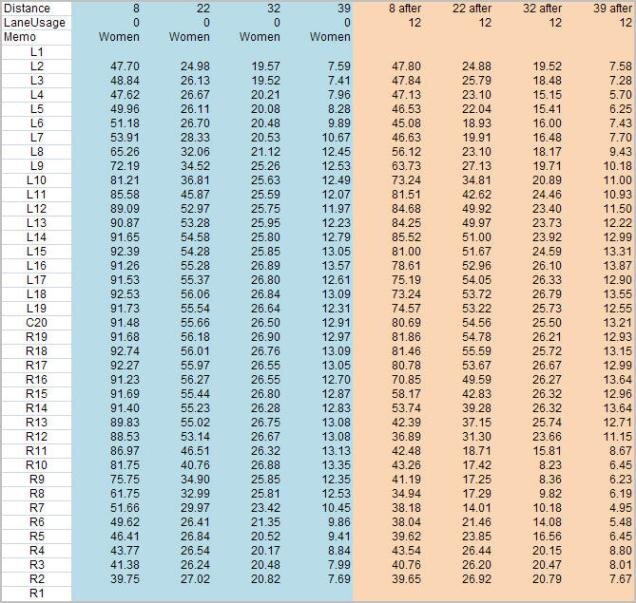
As you can see by this data, the women actually erased more oil off the lane in their lay down area (8’ tape) than the men did, yet still not enough to make the ball hook early, or make them move left because “the fronts have gone away”. The end of the pattern however is once again, another story.
The women have “ganged up” on the exit point of the pattern causing the 10-12 units of fresh oil at 39 feet become 5-6 units by the end of play. At 32 feet, the fresh 25-26 units of oil became 8 units after bowling.
This back-to-front oil pattern breakdown is the cause of the players moving left, not the old school front-to-back oil pattern breakdown we used to have before bowling ball track flare became a dominant force.
Also, to give you an idea how much oil is left on the lane by each group at each tape distance after bowling, here is what the tape data showed as an average amount of units at each tape distance:
- The men players at 8’ had an average of 54.35 units left on the lane, at 22’ an average of 31.73 units, at 32’ an average of 19.93 units, and at 39’ an average of 9.84 units.
- The women players at 8’ had an average of 58.79 units left on the lane, at 22’ an average of 30.79 units, at 32’ an average of 18.60 units, and at 39’ and average of 9.40 units.
Carrydown Data
This next graph and data might surprise some people, although it will make perfect sense once explained. I have been watching this in action over the last few years and it is something as lanemen we have no control over.
During this event we took carrydown tapes of the men and we will show the same percentage graphic as before with an additional twist, the carrydown tape in units. We do this so you can plainly see the exit points within the oil pattern of both the right-handed and the left-handed players.
Here is the graphic with carrydown tape visual (left side is right side of lane, right side of graphic is left side of lane – you are still looking at these graphs from the pins perspective!):
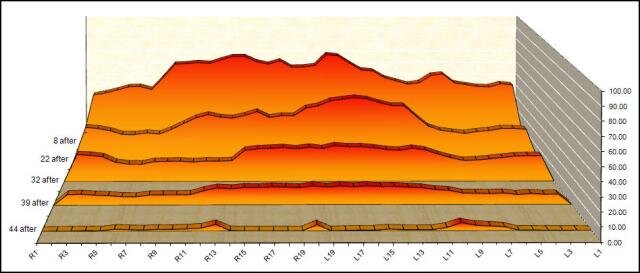
Here is the data, depletion percentages plus carrydown in units of oil:
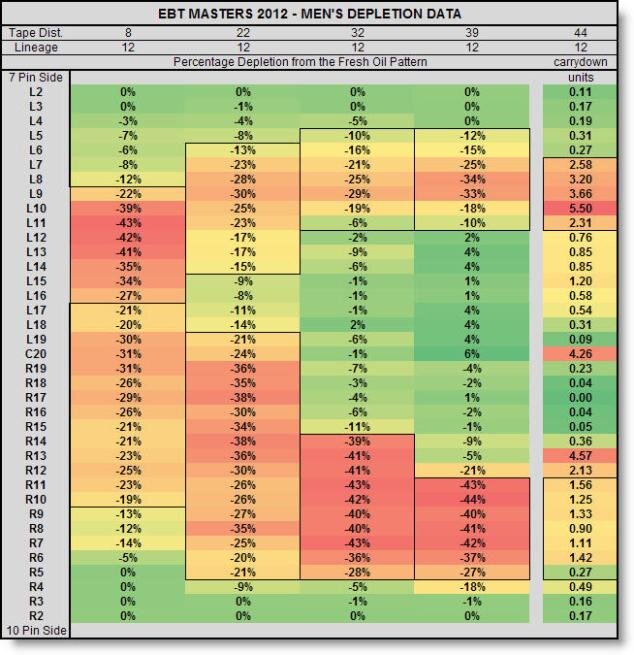
If we look at the blocks which show where both the left-handed and right-handed players played, you can plainly see how much carrydown is on the left side of the lane at the left-handers exit point of the pattern, yet not so much on the right-handers exit point. Why might you ask?
It is actually very simple once we think about it. We know that most spare balls in use today do not flare much, nor do they soak up oil like high flaring reactive resin strike balls that are in use today. So as right-handed players continually shoot spares on the left side of the lane, these non-flaring non-absorbent spare balls leave those long carrydown strips when they exit the oil pattern.
These ball types also do this when players are shooting spares on the right side of the lane, yet the carrydown tapes clearly do not show as much carry down at the end of the pattern.
The answer lies in the amount of high flaring balls going down the lane on the right side of the lane versus the left side of the lane.
Basically, the right-handers strike balls continually erase the carrydown left by the spare balls, but on the left side of the lane there is simply not enough high flaring absorbent balls going down the lane in that area to erase left side spare ball carrydown.
This lane condition change can be beneficial or detrimental to the left-hander. If these left side carrydown strips become dominate inside of target, like on patterns or conditions that allow the outside of the lane to play, it can give the left-hander hold area.
Yet if these spare ball carrydown strips become dominate left of target, or at their exit point, like many medium long or long patterns, it can result in a hang spot or reduced pin carry.
One more thing to be aware of with spare balls on today high volume oil patterns is how they can actually increase the amount of oil at the end of the oil pattern where high flaring balls are not traveling. We saw this happen often in the late 1980’s even where the traffic was when more aggressive coverstocks and larger core urethane balls were mostly in play. The end of the pattern after a couple blocks often had more oil on it than when fresh. It also shows up often in our after tapes in today’s game outside the track area (where most balls are being rolled), which can clearly be seen on the aforementioned data.
The reason for this today and back then is simple, by the mid to late 1980’s the amount of oil on the lane had to significantly increase in order to give the wood lane protection.
The by-product was more carrydown because more oil was being picked up by the ball in the fronts and re-deposited towards the end of the pattern and the dry back end.
This combination led to a great advantage after a few games by high rev big hook ball players as they could simply go around the carry down for return outside of target, and then the carrydown became hold area inside of target for this type player.
We see the same dominant style trend happening again today but for different reasons – this time it’s rapid depletion of the oil pattern from back to front and who can chase the oil inside of target on the lane the fastest.
Normally today, just like in the late 1980’s, it is often the high rev players who can create the largest margin of error and best angle for the best pin carry once the oil conditions are altered simply by bowling.
After reading all this you might be asking yourself what then is the best combination of ball versus lane versus oil that would minimize all this rapid lane condition change? That my friend is another article for another time…